You have skipped the navigation, tab for page content
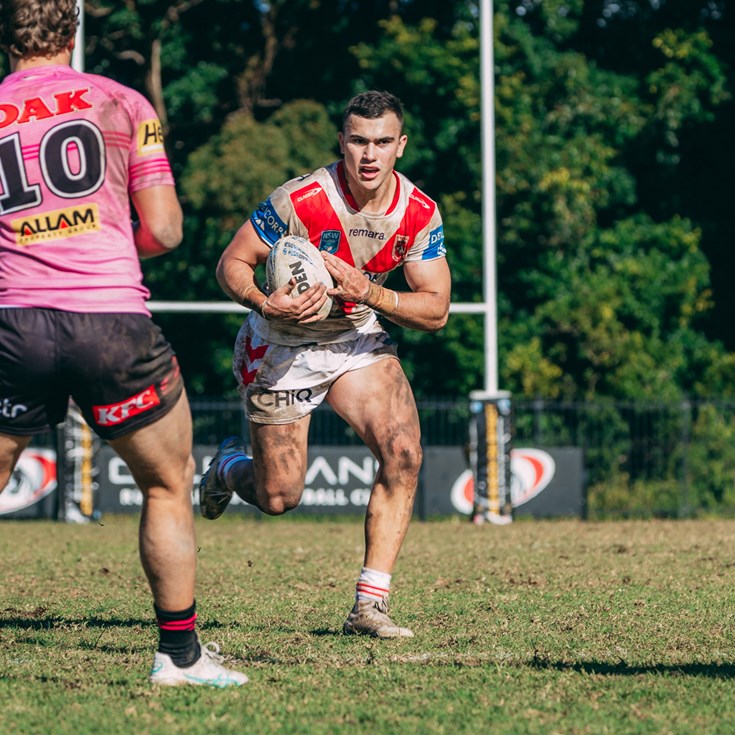
Jett Liu
Prop
Player Bio
- Debut Club:
- St. George Illawarra Dragons NSW Cup
- Date:
- 16 April 2023
- Opposition:
- Canberra Raiders NSW Cup
- Round:
- 7
Career
- Appearances
- 28
- Tries
- 0
2025 Season
- Appearances
- 23
Scoring
- Tries
- 0
Attack
- Tackle Breaks
- 10
- Average Hit Ups
- 9.1
- Post Contact Metres
- 926.7
Passing
- Offloads
- 10
Defence
- Tackles Made
- 541
- Tackle Efficiency
-
Running Metres
- Average Running Metres
- 94
- Total Running Metres
- 2184
Fantasy
- Total Points
- 718
- Average Points
- 31.2
2025 Season - By Round
| Round | Opponent | Score | Position | Minutes Played | Tries | Goals | 1 Point Field Goals | 2 Point Field Goals | Points | Try Assists | Linebreaks | Tackle Breaks | Post Contact Metres | Offloads | Receipts | Tackles Made | Missed Tackles | Total Running Metres | Hit Up Running Metres | Kick Return Metres | |
|---|---|---|---|---|---|---|---|---|---|---|---|---|---|---|---|---|---|---|---|---|---|
| 1 | Bulldogs | Won | 34 - 26 | Interchange | 37 | - | - | - | - | - | - | - | - | 40 | - | 10 | 15 | - | 84 | 84 | - |
| 2 | Rabbitohs | Won | 30 - 18 | Interchange | 37 | - | - | - | - | - | - | - | - | 32 | - | 7 | 24 | 3 | 79 | 58 | 15 |
| 4 | Bears | Lost | 24 - 28 | Interchange | 38 | - | - | - | - | - | - | - | - | 14 | - | 5 | 20 | 3 | 42 | 42 | - |
| 5 | Eels | Drawn | 28 - 28 | Interchange | 47 | - | - | - | - | - | - | - | 1 | 43 | - | 9 | 20 | 2 | 96 | 60 | 32 |
| 6 | Roosters | Won | 44 - 12 | Interchange | 32 | - | - | - | - | - | - | - | 1 | 35 | - | 10 | 13 | 2 | 76 | 49 | 16 |
| 7 | Warriors | Lost | 40 - 12 | Interchange | 56 | - | - | - | - | - | - | - | 1 | 34 | - | 10 | 32 | 4 | 70 | 70 | - |
| 8 | Sea Eagles | Won | 36 - 6 | Interchange | 41 | - | - | - | - | - | - | - | 1 | 77 | - | 16 | 11 | 1 | 155 | 155 | - |
| 9 | Magpies | Won | 26 - 60 | Interchange | 31 | - | - | - | - | - | - | - | - | 22 | - | 5 | 11 | 2 | 60 | 41 | 16 |
| 10 | Jets | Won | 4 - 34 | Interchange | 32 | - | - | - | - | - | - | - | 1 | 34 | 2 | 8 | 17 | 1 | 62 | 62 | - |
| 11 | Bears | Won | 18 - 28 | Interchange | 36 | - | - | - | - | - | - | - | - | 44 | - | 12 | 20 | - | 102 | 73 | 29 |
| 12 | Raiders | Won | 28 - 36 | Prop | 48 | - | - | - | - | - | - | - | - | 32 | - | 15 | 15 | 6 | 107 | 103 | - |
| 13 | Knights | Won | 28 - 24 | Replacement | - | - | - | - | - | - | - | - | - | - | - | - | - | - | - | - | - |
| 15 | Panthers | Won | 38 - 6 | Interchange | 34 | - | - | - | - | - | - | - | 1 | 28 | - | 12 | 22 | - | 76 | 71 | - |
| 18 | Sea Eagles | Won | 22 - 30 | Prop | 53 | - | - | - | - | - | - | - | - | 51 | 3 | 16 | 30 | 1 | 128 | 111 | - |
| 19 | Roosters | Won | 18 - 28 | Prop | 61 | - | - | - | - | - | - | - | - | 70 | 1 | 17 | 28 | 3 | 152 | 140 | 12 |
| 20 | Rabbitohs | Won | 22 - 32 | Prop | 49 | - | - | - | - | - | - | - | 1 | 36 | 1 | 12 | 25 | 1 | 102 | 96 | - |
| 21 | Jets | Lost | 40 - 16 | Interchange | 42 | - | - | - | - | - | - | - | - | 20 | 1 | 11 | 27 | - | 58 | 58 | - |
| 22 | Warriors | Drawn | 14 - 14 | Prop | 55 | - | - | - | - | - | - | - | 1 | 40 | - | 13 | 34 | 4 | 91 | 91 | - |
| 23 | Raiders | Lost | 14 - 32 | Prop | 61 | - | - | - | - | - | - | - | - | 37 | - | 15 | 38 | 3 | 92 | 84 | 8 |
| 24 | Knights | Lost | 22 - 6 | Prop | 58 | - | - | - | - | - | - | - | - | 38 | - | 9 | 29 | - | 81 | 76 | - |
| 25 | Panthers | Won | 30 - 31 | Prop | 69 | - | - | - | - | - | - | - | - | 76 | 2 | 23 | 35 | 1 | 182 | 156 | 21 |
| 26 | Bulldogs | Lost | 46 - 10 | Lock | 48 | - | - | - | - | - | - | - | - | 38 | - | 10 | 21 | 1 | 85 | 81 | - |
| 27 | Eels | Won | 24 - 18 | Prop | 67 | - | - | - | - | - | - | - | 2 | 37 | - | 18 | 28 | 3 | 89 | 83 | 5 |
| 28 | Warriors | Won | 10 - 24 | Prop | 51 | - | - | - | - | - | - | - | - | 48 | - | 14 | 26 | 1 | 106 | 102 | - |
Career By Season
| Year | Played | Won | Lost | Drawn | Win % | Tries | Goals | 1 Point Field Goals | 2 Point Field Goals | Points | Tackle Breaks | Post Contact Metres | Offloads | Tackles Made | Missed Tackles | Tackle Efficiency | Total Running Metres | Average Running Metres | Kick Return Metres | Total Points | Average Points | |
|---|---|---|---|---|---|---|---|---|---|---|---|---|---|---|---|---|---|---|---|---|---|---|
| Dragons | 2023 | 5 | - | 5 | - | - | - | - | - | - | - | - | 70 | - | 69 | 6 | 92.00% | 168 | 33.00 | - | 70 | 14.0 |
| Dragons | 2025 | 23 | 15 | 6 | 2 | 65% | - | - | - | - | - | 10 | 927 | 10 | 541 | 42 | 92.80% | 2,184 | 94.00 | 157 | 718 | 31.2 |
Career Overall
| Year Start | Year End | Played | Won | Lost | Drawn | Win % | Tries | Goals | 1 Point Field Goals | 2 Point Field Goals | Points | Tackle Breaks | Post Contact Metres | Offloads | Tackles Made | Missed Tackles | Tackle Efficiency | Total Running Metres | Average Running Metres | Kick Return Metres | Total Points | Average Points | |
|---|---|---|---|---|---|---|---|---|---|---|---|---|---|---|---|---|---|---|---|---|---|---|---|
| Dragons | 2023 | 2025 | 28 | 15 | 11 | 2 | 54% | - | - | - | - | - | 10 | 997 | 10 | 610 | 48 | 92.71% | 2,353 | 73.00 | 157 | 788 | 28.1 |
Latest
Team Mates
St George Illawarra Dragons respect and honour the Traditional Custodians of the land and pay our respects to their Elders past, present and future. We acknowledge the stories, traditions and living cultures of Aboriginal and Torres Strait Islanders peoples, where our games are played, our programs are conducted and in the communities we support.